Get a quote
New Statistics About The Safety of British Roads
Apr 4 2022 11:37AM
The newest statistics showing the UK's road traffic accidents have been released on GOV.co.uk. At first glance you might think the stats show that British drivers have become less safe, but we're here explain why that's not the case.
The Statistics
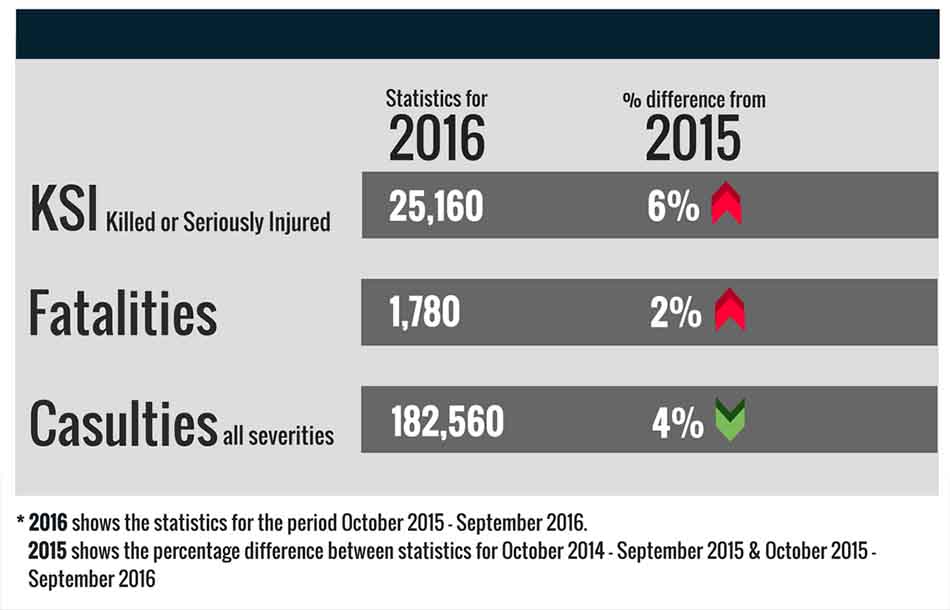
Although we've had more deaths and serious injuries recorded this year, compared to last, the overall number of casualties has decreased by 4%. Why might this be?
The CRASH system
CRASH (Collision Recording and Sharing system) is the new centralised system that the police forces use to record road traffic collisions. Beforehand, it was the duty of the officer to identify all the injuries a crash victim suffered and categorise the person as either a ‘severely injured’ or ‘slightly injured’ person. According to local authorities, officers would more often underestimate the severity of somebody’s injuries than overestimate them. With CRASH, the officer inputs the injuries of the victim and CRASH objectively analyses whether the victim is 'severely injured' or 'slightly injured'. These objective outcomes have probably reduced the number of underestimations made by the police.
So how safe are British people driving?
Results would suggest a greater awareness of road safety, with overall causalities dropping by 4%. In the report, it regards the increase in fatalities, across the year, as not ‘statistically significant’ and more of an anomaly. This is because there is no clear correlation between the statistics and any significant change in UK driver behaviour or UK road laws. Additionally, although fatalities increased from 2015 - 2016, within this quarter (July – September 2016) there was a decrease in fatalities, when compared to the previous quarter (April – June 2016).
Other points of interest for provisional drivers
Road traffic has increased by 1.4% from last year, so those who are thinking of taking to the roads for driving lessons or private practice, you can expect to see a lot more traffic than previous years. In terms of the dangers of driving on different road types, this report looked at accident rates for major roads, minor roads, built-up roads and non-built-up roads. The total ‘Number of Accidents / Number of Fatalities’ for each road type (during the period July – September 2016) were:
- Major roads (Motorways & A roads) – 17,190 accidents / 270 fatalities
- Minor roads (B, C or Unclassified roads) – 18,270 accidents / 160 fatalities
- Built-up roads (Speed limits of 40 mph or less)– 26,520 accidents / 190 fatalities
- Non-Built-up roads (Speed limits over 40 mph) – 8,940 accidents / 240 fatalities
Some tips for our provisional insurance customers
Here are some tips to keep you safe:
- Speed limits are limits not targets, don’t seek to reach a certain speed if you are not comfortable doing so.
- If you’re unsure, then wait, don’t move off unless you are certain it’s safe to do so.
- Pick your time wisely. Try to avoid going out during peak times.
If you would like to get your own provisional insurance policy – Click here
